4. Electronic tools#
This week, i was able to choose a tools that I wanted to learn more about :) I chose the electronic group and we worked on microcontrollers.
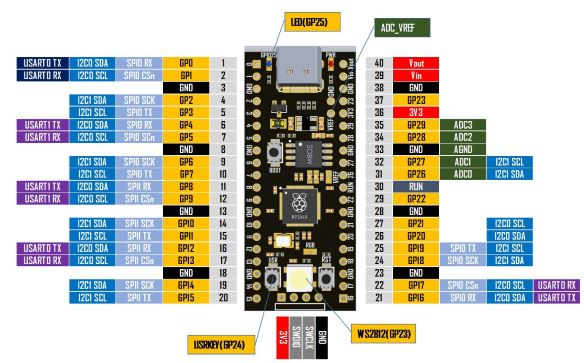
Raspberry#
The Raspberry Pi Pico (RP2040 microcontroller) is a microcontroller board that we will control with the help of Arduino software.
It is designed for embedded systems task.
It uses C Language but we could also have used Thonny and it would have been in python.
First task: Humidity and temperature sensor#
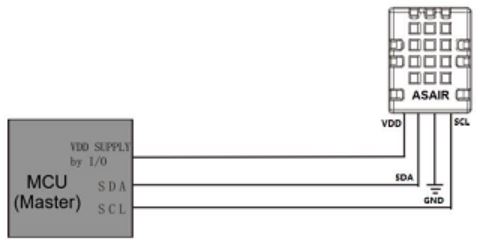
The sensor we will use DHT20.
DHT sensors are combined temperature and humidity sensors with a digital output over an interface.
In this case, we were able to connect it to our computers and get the exact numbers of humidity/T°
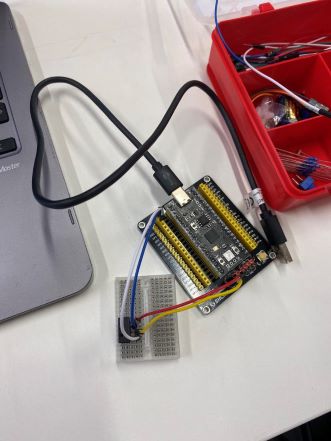
Connect the sensor to the board#
With the help of the data sheet, i was able to connect my sensor to the microcontroller board.
It looked like this:
Download DHT20 and find DHT20_plotter#
The first thing you’ll have to do is download DHT20 in the library.
It should look like this:
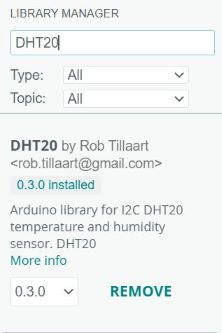
After that, you’ll be able to find DHT20_plotter in files/examples/DHT20/DHT20_plotter
This will give you the code you need to be able to create a plot showing you the humidity going through the sensor.
I changed a little bit the code because I wanted to change DHT.begin()
#DHT.begin()
  Wire.setSDA(0)
  Wire.setSCL(1);
  Wire.begin();
The numbers that you put inside the brackets are the position of your SDA cable and SCL cable on the micro.
I know what you’re going to tell me… WTF ARE THOSE ???
Well it’s easy, look at this:
//    FILE: DHT20_plotter.ino
//  AUTHOR: Rob Tillaart
// PURPOSE: Demo for DHT20 I2C humidity & temperature sensor
//
//  Always check datasheet - front view
//
//          +--------------+
//  VDD ----| 1            |
//  SDA ----| 2    DHT20   |
//  GND ----| 3            |
//  SCL ----| 4            |
//          +--------------+


#include "DHT20.h"

DHT20 DHT(&Wire);


void setup()
{
  Wire.setSDA(0);
  Wire.setSCL(1);
  Wire.begin();
  //  ESP32 default pins 21 22
  Serial.begin(115200);
  Serial.println("Humidity, Temperature");
}

void loop()
{
  if (millis() - DHT.lastRead() >= 1000)
  {
    //  note no error checking
    DHT.read();
    Serial.print(DHT.getHumidity(), 1);
    Serial.print(", ");
    Serial.println(DHT.getTemperature(), 1);
  }
}
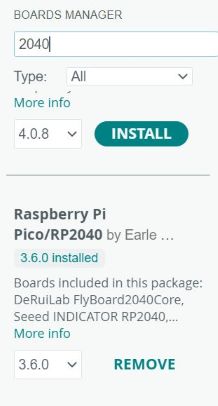
Download Raspberry Pi Pico\RP2040#
You will not be able to find it in the library so you’ll have to go in files/preferences/add board manager. There you’ll have to paste this link: “https://github.com/earlephilhower/arduino-pico/releases/download/global/package_rp2040_index.json”
After this, you’ll be able to find in your board manager and install it.
Common problem#
Nearly everyone in the class had the same problem which gave us:
Failed uploading: uploading error: exit status 1
I’m gonna give you the solution in tiny steps in case you have the same problem:
1) disconnect the microprocessor from your computer and reconnect it while pushing on the button “BOOT”
2) By doing that, you’ll see UF2 appear on ports and you will select it and also choose Generic RP2040 as the board manager.
3) Upload once and this will make you appear a new port (USB), choose this one as the main port and select Raspberry Pi Pico\RP2040 as the board manager
4) Upload and it should work :))
Results#
When everything works (finally), you can click on serial plotter and this will give you a graph in real time of the temperature and humidity.
If you blow on the sensor, you can see an increase in both of the graphs!
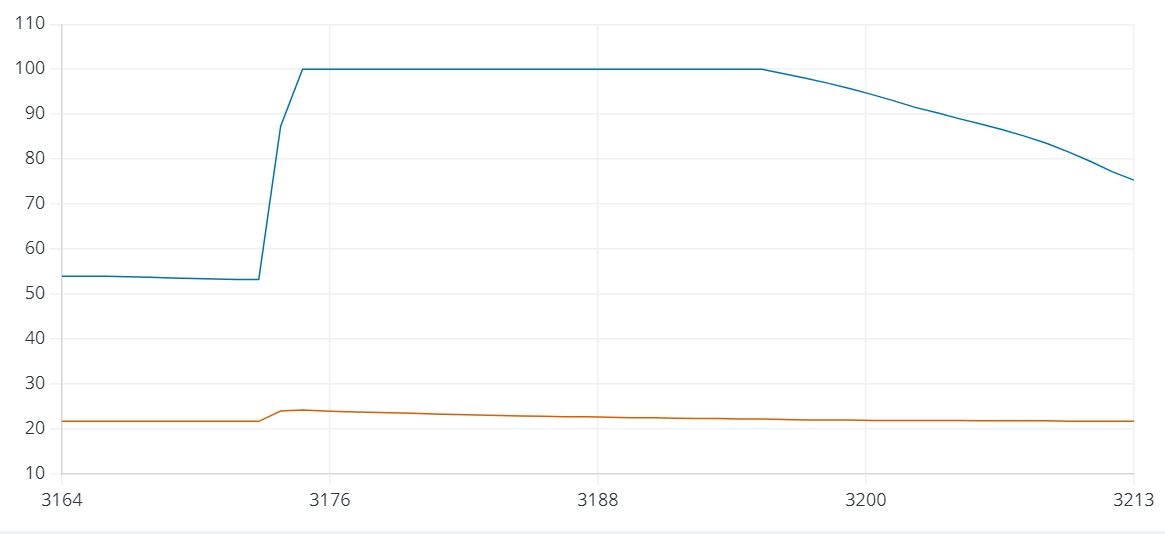
Looks cool right ?
Second task: Neopixel#
The task was to use the built-in RGB LED to display colors.
To display colors, you will have to play with Red, Green and Blue with numbers going from 0 to 255.
By mixing differents intensity of colors, you will be able to have a bigger range :))
| colors | code |
|---|---|
| Yellow | Red(255,255,0) |
| Purple | Red(255,0,255) |
| Violet | Blue(138,43,226) |
| Turquoise | Green(64,224,208) |
| Pink | Red(255,105,180) |
With a little bit of the help of the code that was given to us here
I made a code which creates a loop that cycles through the colors: red, orange, green, pink, turquoise, and violet and each color is displayed for 1 second.
// File : lights.micropython
//Author : Camille Lamon
// Date : 15/11/2023
// License : Creative Commons Attribution-ShareAlike 4.0 International [CC BY-SA 4.0](https://creativecommons.org/licenses/by-sa/4.0/)
# Import necessary packages
from machine import Pin
import neopixel
import time

# Initialize 1 neopixel on pin 23
np = neopixel.NeoPixel(machine.Pin(23), 1)

while True: # Repeat indefinitely

    # Set the neopixel to Red
    np[0] = (255, 0, 0)  # (Red, Green, Blue)
    np.write()
    time.sleep(1)  # Pause for 1 second

    # Set the neopixel to Orange
    np[0] = (255, 30, 0)  # (Red, Green, Blue)
    np.write()
    time.sleep(1)  # Pause for 1 second

    # Set the neopixel to Green
    np[0] = (0, 255, 0)  # (Red, Green, Blue)
    np.write()
    time.sleep(1)  # Pause for 1 second

    # Set the neopixel to Pink (a shade of red)
    np[0] = (255, 105, 180)  # (Red, Green, Blue)
    np.write()
    time.sleep(1)  # Pause for 1 second

    # Set the neopixel to Turquoise
    np[0] = (64, 224, 208)  # (Red, Green, Blue)
    np.write()
    time.sleep(1)  # Pause for 1 second

    # Set the neopixel to Violet
    np[0] = (138, 43, 226)  # (Red, Green, Blue)
    np.write()
    time.sleep(1)  # Pause for 1 second
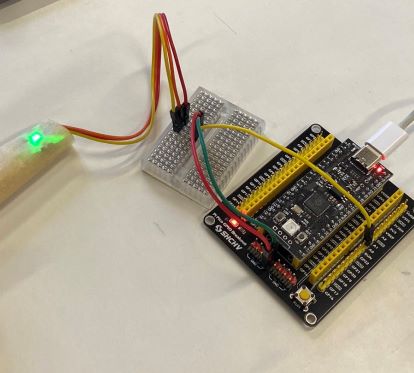
Also really important, do not forget to specify the port of the RGB led in this case, port 23 which can be found in the data sheet. here The led looked like this: click
Third task: pulse sensor#
The final challenge was to add an output device.
I study biomedical engineering so it was obvious for me to choose the pulse sensor.
And it was H A R D
How does pulse sensor works ?#
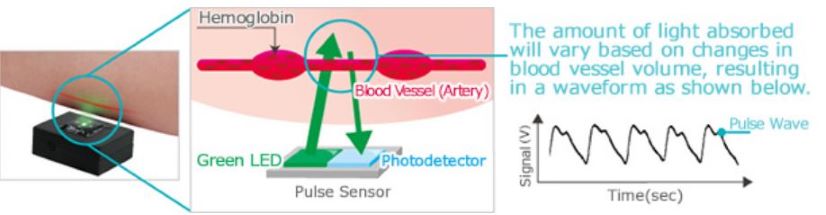
A pulse wave is the change in the volume of a blood vessel that occurs when the heart pumps blood, and a detector that monitors this volume change is called a pulse sensor.
This sensor is part of the transmission group who measure pulse waves by emitting red light from the body surface and detecting the change in blood flow during heart beats as a change in the amount of light transmitted through the body.
The following image comes from here and explains it quite well.
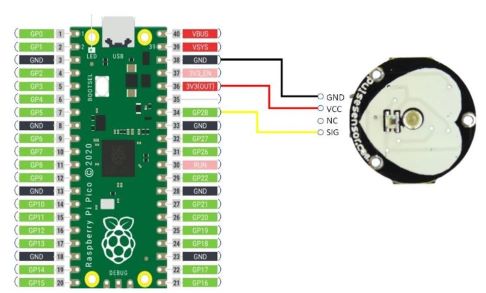
Connecting the cables#
By looking at this data sheet, I was able to connect my sensor to the raspberry pie
Raw Data#
I followed this tutorial: here
So let’s explain steps by steps in case someone wants to go through hell just as me ;(
I decided to use Thonny and code in micropython for a change ^^
The first thing i did was to change the interpeter on thonny in Tools/option/interpreter
I chose Micropython Raspberry Pi pico as my main interpreter and then I chose my USB port
I did the first step of the tutorial which is not mandatory but still interesting.
It allows us to analyze the raw data of the pulse sensor.
I used this code:
# Author: peppe8o
# Date: Oct 15th, 2022
# Version: 1.0
# blog: https://peppe8o.com
from machine import ADC #import the required module

pulse=ADC(26) # setup the Pulse Sensor reading pin
file = open("EmptyTest.txt", "w") # name of the file where the data will be stored
x=0 #initialize a counter

# main program
while x<10000: #the loop goes on until x gets to 10000
    x=x+1 #increment the variable
    try:
        value=pulse.read_u16()
        file.write(str(value)+"\n")

    except OSError as e:
        machine.reset() #reset in case of an error
I ran the script twice!
once with: file = open("PressedTest.txt", "w") and with my finger pressing on the sensor
Then the second time I changed that line to: file = open("EmptyTest.txt", "w") and i didn’t put my finger on
I was able to find those files in View/files and I downloaded them to then insert them in the premade excel file that you can find in the tutorial.
I only looked at the pressed files on the graphic and not the empty.
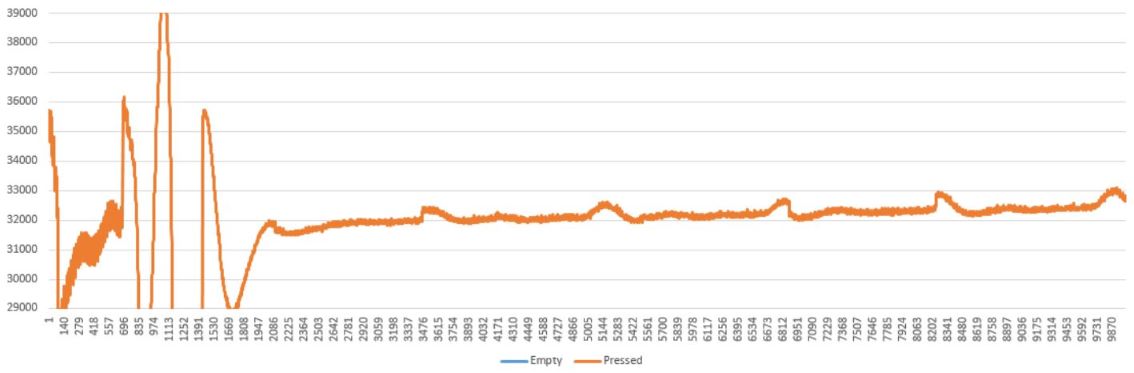
The first graph informed me that when you press, there’s not a lot of variability with higher max values and lower min values. On the other side, we know that there is more variability if you don’t press so we’ll use this in order to detect if a finger is present or not.
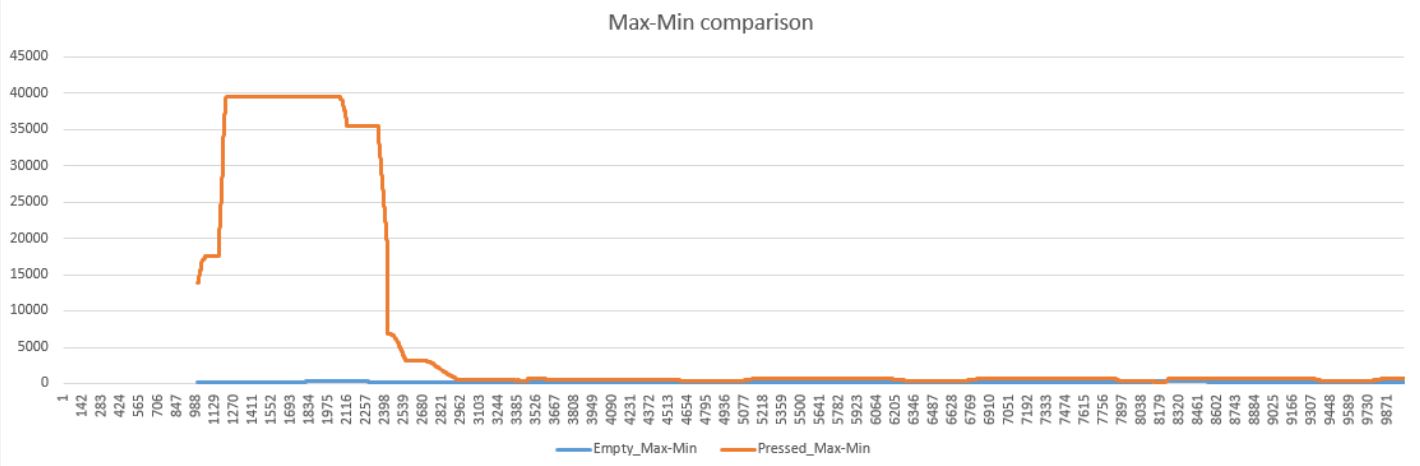
The second graph shows that calculating the Max values – Min values give us a clear threshold to detect if the finger is present.
From this chart, the creator stated that:
calculation <2000 ==> “finger detected” state
calculation >2000 ==> only the environment noise so nothing is present.
Now we can create a new code and to detect the heartbeat we need to compare the pressed averages.
Sensor code#
The final code (that i adjusted for my build) is:
// File : final product.scad
//Author : Camille Lamon
// Date : 10/10/2023
// License : Creative Commons Attribution-ShareAlike 4.0 International [CC BY-SA 4.0](https://creativecommons.org/licenses/by-sa/4.0/)
from machine import Pin, ADC     # Import Pin and ADC classes
from time import sleep_ms       # Import sleep_ms function
import neopixel                # Import neopixel library to control the LED

# Initialize the LED on Pin 23
np = neopixel.NeoPixel(Pin(23), 1)

# Create an ADC object for reading analog values from a potentiometer on Pin 26
pulse = ADC(26)

# Open two files for writing data
file = open("Avg.txt", "w")
file2 = open("results.txt", "w")

# Initialize variables
x = 0
max_samples = 1000
short_average = 35
long_average = 300
beat_threshold = -50
finger_threshold = 1000000
history = []
hist_avg = []
avg = 0

# Define a function for detecting a finger
def finger_detected(beat_thresh):
    avg_1 = sum(history[-short_average:]) / short_average
    avg_2 = sum(history[-long_average:]) / long_average
    avg = avg_1 - avg_2

    if avg > beat_thresh:
        np[0] = (255, 0, 0)  # Set the LED color to red
    else:
        np[0] = (0, 0, 0)    # Turn off the LED
    np.write()
    return avg

# Main program loop
while x < 3000: #make the 3000 cycles
    x = x + 1 # increment
    try:
        # Read a 16-bit unsigned integer value from the potentiometer
        value = pulse.read_u16()
        # Append the value to the history list
        history.append(value)
        # Maintain a sliding window of sensor readings
        history = history[-max_samples:]
        # Append the current average to the hist_avg list
        hist_avg.append(avg)
        # Maintain a sliding window of the average values
        hist_avg = hist_avg[-100:]

        if max(history) - min(history) < finger_threshold:
            # Calculate the beat threshold
            beat_threshold = (max(hist_avg)) * 0.5
            # Detect a finger and write the average to Avg.txt
            avg = finger_detected(beat_threshold)
            file.write(str(avg) + "\n")
            # Write the beat threshold to results.txt
            file2.write(str(beat_threshold) + "\n")
        else:
            np[0] = (0, 0, 0)  # Turn off the LED
        np.write()
    except OSError as e:
        machine.reset()  # Reset the microcontroller in case of an error
Be aware that this part of the code will change according to your provided structure:
np = neopixel.NeoPixel(Pin(23), 1)
pulse = ADC(26)
In the end, I was able to get this:
final
Checklist#
- Documented what I've learned from interfacing input devices to a microcontroller and how the physical property relates to the measured results
- Documented what I've learned from interfacing an output device to a microcontroller and controlling the device
- Programmed my board
- Described my programming process
- Outlined problems and how I fixed them
- Included original design files and source code
- Included a "hero shot/video" of my board in operation